The Quarterly
Author
BresicWhitney
Q2 2026
Recent months have brought three consecutive interest rate rises, a federal budget that proposed the most significant changes to property investment policy in a generation, and a volatile global backdrop, each shaping the conditions in which Sydneysiders have made their real estate decisions.
This edition of The Quarterly explores the themes shaping the Sydney property market, and the influence they'll have in the months ahead. The market took longer to move, with days on market climbing to their highest point in over a year, and auction clearance rates softening alongside this.
But slower didn't mean simpler. Some of the fastest sales of the year also occurred within the quarter, reflecting new pathways for those moving decisively. While buyers and sellers navigated a more complex landscape, so too did investors and tenants, with the rental sector facing its most significant structural test in years.
Read on for a closer look at where the market is heading, and what to watch for next.
“Property markets don’t move on data. They move on decisions. Sydney is still making them, just with more weight, and against a different set of inputs than this time last year.”


Amid the doom and gloom, watch for the next recovery in Sydney markets.
Markets and media commentary over the past few months have been heavily focused on the current downturn in Sydney’s property market. While there’s little doubt that property demand has taken a hit and Sydney home values are falling, history tells us that downturns in the Australian property market don’t tend to last very long, and typically have recoveries that return values to their previous peaks and beyond at a fairly rapid pace. This can present opportunities for buyers ready to take advantage of shifts in the market.
What does a downturn in Sydney’s market look like?
Sydney’s property market tends to be more volatile than the national average, meaning that home values typically increase more rapidly than average during an upswing, but similarly fall further during a downturn.
When we dig into long run home value data for Sydney, we identify twelve distinct downturns since 1984, each with a range of different drivers behind them, from recessions to shifts in monetary policy and changes in regulation.
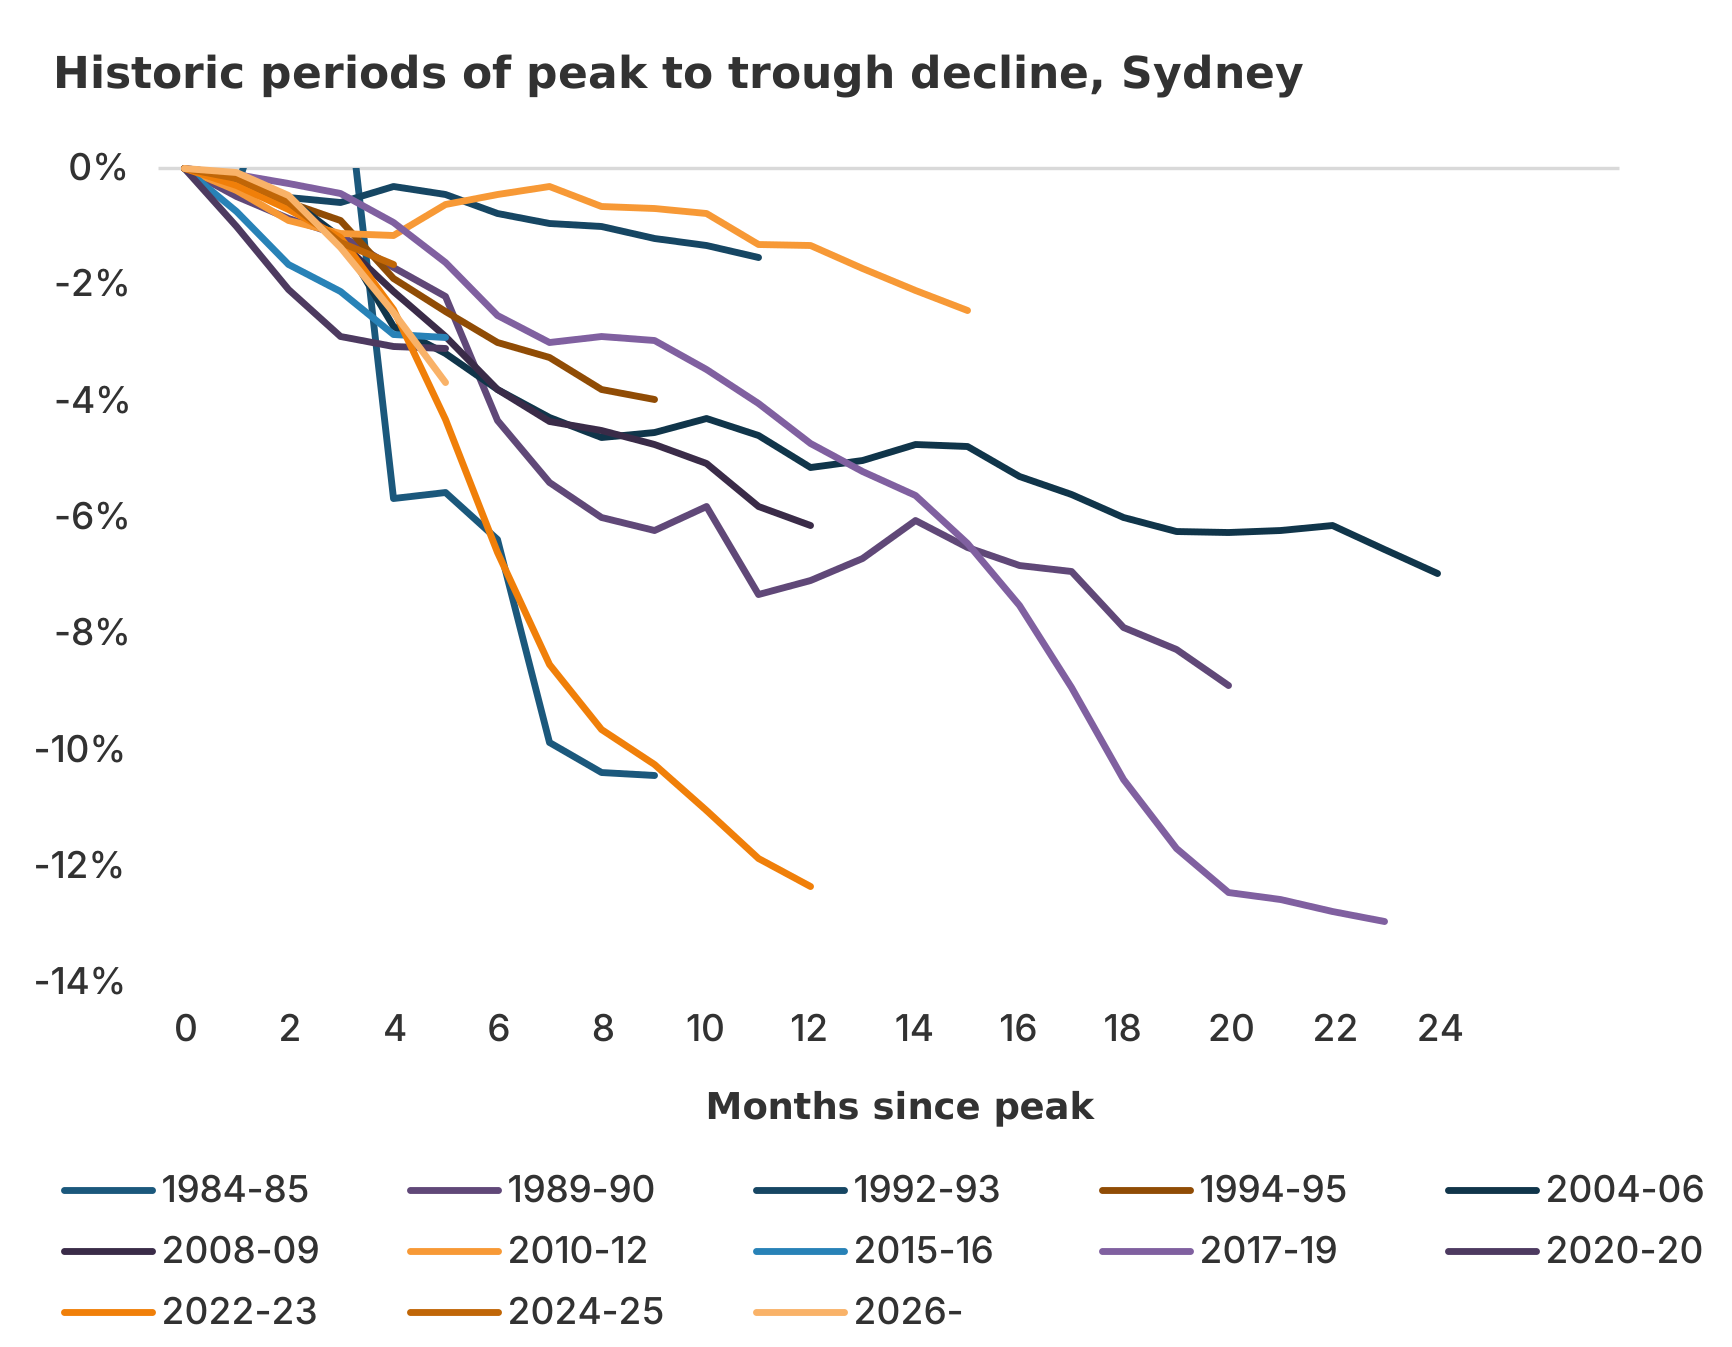


Of these twelve examples, just four lasted longer than twelve months, namely the downturn in 1989-90 (associated with the recession of this period), 2004-06 (which represented a correction following a near decade long boom), 2010-12 (as post-GFC stimulus ended and interest rates rose) and 2017-19 (APRA policy regarding investor borrowing and the banking royal commission tightened lending standards). The final example recorded the largest peak to trough decline at 13%, however three-quarters of these downturns recorded single digit declines across their durations.
The flow of new listings onto the market has also slowed significantly since the start of June. Potential vendors appear to be pulling back, on the basis of having missed the peak of the cycle to sell. Many may choose to wait until home values recover before testing the market again. This could limit how far home values decline in the current downturn.
What does a recovery in Sydney’s market look like?
There is no typical profile for a recovery, as a range of factors impact the path of values through a housing cycle. These include the severity of the initial downturn, the broader economic environment during the period, along with the sentiment and capacity of buyers to enter the market.
Three of the five most recent downturns in the Sydney market fully recovered to their previous peak within twelve months, albeit the troughs of these cycles were relatively modest. The cumulative falls in Sydney home values over the past five months have already exceeded these examples, suggesting that a longer subdued period is probable this time, with a rate cut from the Reserve Bank of Australia (RBA) looking unlikely in the first half of next year. However, another four cycles saw a full recovery within a two-year window.
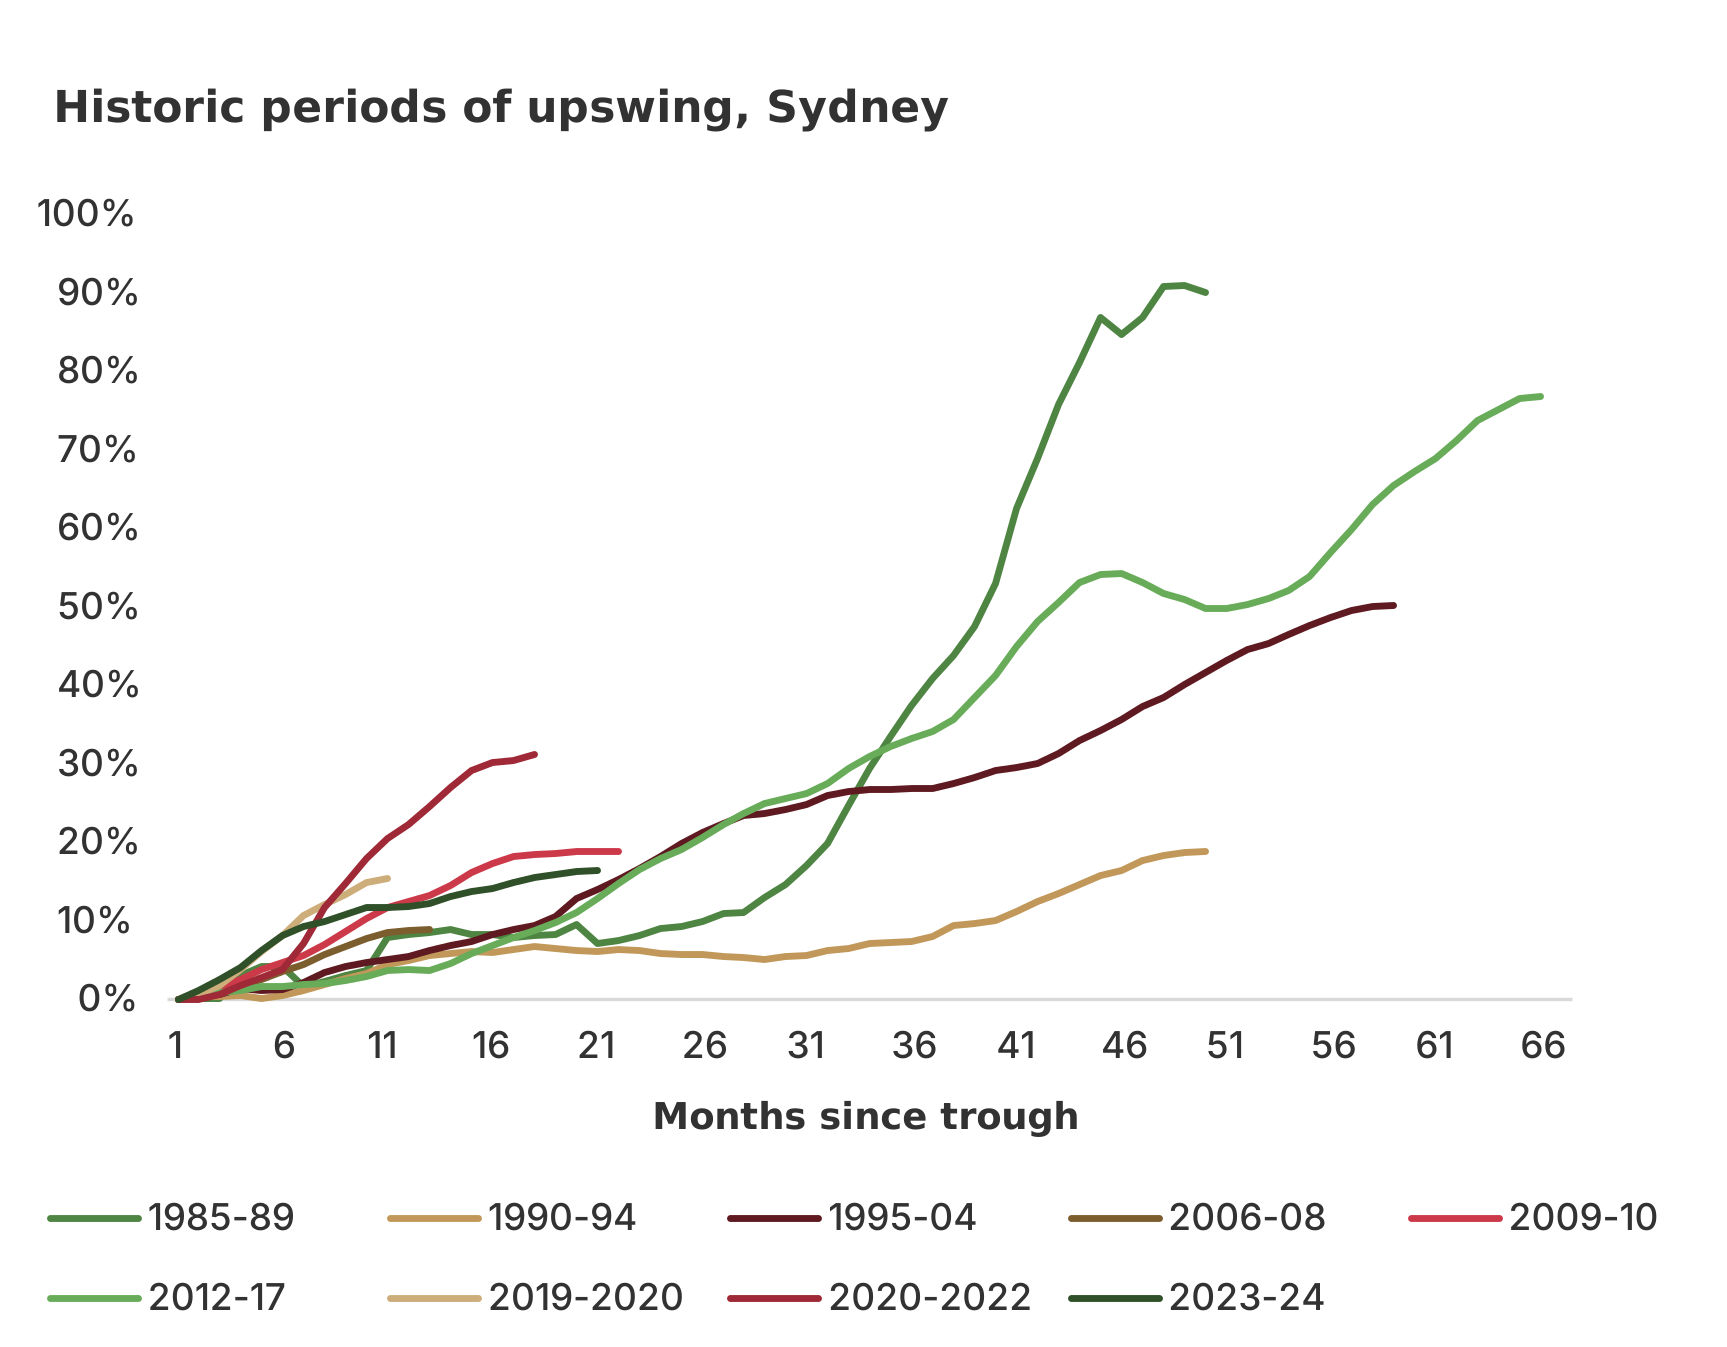
Regardless of the duration, every upswing has seen a robust recovery from its trough, with the smallest gain being an 8.9% increase between 2006 and 2008, with this period impacted by the shock of the Global Financial Crisis. Most recoveries have lasted longer and resulted in double digit increases in value, highlighting the opportunities for buyers and sellers at various stages of the cycle.
While forecasting the turning point is challenging, it is unlikely we’ll see it before we see an easing in cost-of-living pressures, a rebound in consumer confidence and a clear path to rate cuts from the Reserve Bank. If the RBA’s forecasts prove to be accurate, that is unlikely to occur before the second half of 2027.


Sydney's property market slowed in Q2, but it’s the distinction between ‘slowing’ and ‘stopping’ that informs the path ahead.
Days on market for available homes - the length of time a property was advertised online before it was sold - climbed through the quarter, before easing in June. The average rose from 27 days in Q1 to 36 days in April and an average of 41 days in May. Increased competition across June reduced the average down to 32 days, delivering an average of 37 days in total across the quarter. This is 16% higher than this time last year (32 days, Q2 2025), reflecting the reality of a softer property marketplace.
The number of active buyers in market fell 16.3% year-on-year across the quarter, according to data tracked by BresicWhitney. On an annualised monthly basis, the decline was steepest in May, down 22.2% year-on-year, followed by June (-14.6%) and April (-8.6%). Combined with longer days on market, this evidences the reduced buyer activity and competition across winter.
The number of total homes listed for sale, however, remained healthy through much of the quarter. A total of 132 properties came to market in April, up 50% on the 88 listed the same month last year, and 147 in May, up 13.8% on 130 in May 2025. June told a different story, with 87 new listings, down 41.2% on the 148 recorded in June 2025.
While this is consistent with the seasonal slowdown Sydney's property market traditionally sees heading into winter, it marks the return of a pace that the city has not experienced since the 2020 pandemic.
Across Q2, BresicWhitney listings fell 20.8% on Q1, yet still outpaced those recorded this time last year. A sign that while the current slowdown is pronounced, it’s largely seasonal, not structural.


“The market has slowed, and that’s worth saying clearly. What we’re not seeing is disengagement, however. Buyers are taking longer to act, but those doing so are serious. The shift is in pace, not intent.”
As for auctions, BresicWhitney's Q2 clearance rate of 69%, reflected a modest decline on both 1Q 26 (76%) and 2Q25 (75%). The number of active bids per auction also fell - approximately 12 bids per auction in Q1 to 8 in Q2 - even as registered bidder numbers held broadly steady at 2.6 per sale.
The Sydney-wide auction clearance rate, finalised in the low 40s in the closing week of June (Cotality), signalled the wider market operating well below its usual pace.
60% of BresicWhitney properties that sold at auction in Q2, sold above their reserve. A result largely in line with Q2 2025, and reflecting solid competition amongst buyers for these homes. But the margin between reserve prices, set by the seller, and end sold prices narrowed across the quarter, with homes sold at auction selling for 2.4% above their reserve. A reduction from the 3.6% average in Q1, and one of the ways vendors are demonstrating their commitment to meeting the current market.
A portion of homes scheduled for auction at the start of their campaigns never made it to the floor - with three in four BresicWhitney properties (123 homes) selling prior to auction in Q2.
Running alongside was a parallel market that never reached the portals at all, and one that will remain a prevalent method of sale in the months ahead. 15.4% of sales in June, 16.4% in May and 18.1% in April transacted off-market with BresicWhitney in the quarter, equating to almost one in five homes selling without a public marketing campaign.
In the same quarter that produced Sydney's longest average days on market in over a year and the easing of auction clearance rates, some of the fastest and most decisive transactions of the season were taking place.
A number of sales across BresicWhitney demonstrated buyers making efficient and decisive property decisions; and campaigns that defied the wider experience.
In Leichhardt , a buyer inspected a property for the first time at 3pm and exchanged at 7:30pm the same evening. In Marrickville, a family who had recently relocated to Australia viewed a Federation home on Saturday and purchased on the Sunday. In Rozelle, a property had its first inspection at 12:30pm and exchanged at 8pm that night. In Hunters Hill, a waterfront home was inspected on Sunday, reinspected on Tuesday, and exchanged Wednesday afternoon, prior to auction.
"The speed feels at odds with the broader conditions, but this kind of activity is something we see in every cycle,” said Mr Gosse. “It's just easier to spot when the surrounding market is slower.”

“For the right buyer and the right property, Sydney still moves quickly.”
It wasn't just properties listed publicly, either. In Paddington, a terrace listed off-market sold in 24 hours, inspected on a Thursday evening and exchanged the following day. In Glebe, an apartment listed off-market was viewed by its eventual buyer at 9am and had sold by 6:30pm the same day.
“What we're seeing right now isn't a two-speed market, it's three,” Mr Gosse said. “Those who are thinking about buying in the future, those who are looking to buy now, and those who have already bought. That third group has always been there. Expect the conversation around a tri-speed market to become more prevalent as current conditions persist.”


Sydney's rental market tightened in Q2. According to REINSW , vacancy across Sydney sits at 1.7% - well below the 3% that’s widely considered as reflecting a balanced landscape. It’s a figure Sydney is well accustomed to, with the vacancy rate having sat sub 3% for more than two years.
Across the majority of lifestyle-driven suburbs, those within an approximate 10-kilometre radius of the CBD, conditions are tighter still, with vacancy in several locations sitting below 1%. Competition, lack of housing supply, and proximity to the harbour, amenity, and the city’s major cultural and employment hubs remain leading generators of continued demand.
Head of Property Management, Chantelle Collin said quality remained front of mind for tenants, as they became increasingly value-conscious in light of ongoing affordability pressures. "Quality homes continue to attract strong enquiry and lease quickly when priced appropriately," she commented. This was evident across the group, with BresicWhitney leasing 400+ properties in Q2, a 26% increase on the same period last year, at an average weekly rent of $955.
Affordability – or the ‘affordability ceiling’ - is now shaping tenant behaviour as much as the lack of supply is. However, where renters once absorbed rent increases by stretching budgets, many are now adapting differently - moving into share houses, downsizing to smaller properties, or relocating to more affordable suburbs. Domain’s Chief Economist Nicola Powell described it simply: when a tenant runs out of capacity to pay, they shift. The result is a rental market where low vacancy and softening rents can coexist in the same suburb - a dynamic already visible across several of Sydney's inner and middle ring markets.


Rental costs remain a leading consideration for tenants, with Cotality revealing Sydney apartment rents have risen 51% in under five years. Australian renters now commit a record 33.1% of gross household income to rent, a notable increase from the 26.2% in 2020.
“Housing affordability and rental affordability are closely connected. Supporting pathways to home ownership is important, but so too is ensuring there is sufficient rental housing available for those who rent by choice or necessity,” Ms Collin said.
For property owners and investors, the conversation is increasingly centred around policy changes and market outlook. The 2026 Federal Budget sharpened the conversation, with the proposed changes to property investment policy marking the most significant potential reforms in a generation.
Most owners of investment properties continue to take a long-term view, Ms Collin said, with the grandfathering arrangements providing a level of confidence. Large-scale shifts in investor behaviour across the Inner City, by way of selling current properties, had not yet materialised, she said. More prevalent is whether reduced future investment activity compounds an already constrained supply picture for tenants, and the role both forces have in delivering a balanced and sustainable rental market.
"At this stage, the impact is likely to be felt more through investor sentiment than investor behaviour,” Ms Collin said. “The more important long-term question is whether fewer investors choose to enter the market in future. In a city where vacancy remains well below balanced levels, maintaining adequate rental supply will continue to be critical.”

“Every cycle we’ve navigated has looked, at some point, like the one that wouldn’t resolve. They always do.”
If history tells us anything, it’s that the property market will enter an upswing– a pattern that every Sydney downturn since 1984 has followed. With a rate cut unlikely before the second half of 2027, the path back will take time. The shape of that recovery, and how quickly Sydney finds its footing, will largely come down to three forces: the rate cycle, the investor decision ahead of 1 July 2027, and supply.
The cash rate sits at 4.35 per cent following three rises in the first half of the year. The Budget changes don't take effect until July 2027, yet they're already shaping decisions, with some investors choosing to hold, others to sell, and others turning to newly built properties instead. In the rental market, vacancy remains at historic lows, with supply yet to respond at any real pace.
Sydney property has absorbed a lot over the years, Mr Gosse said: rate cycles, policy shifts, global shocks. However, one enduring truth remains. “What tends to stay is people's relationship with where they live. Sydney remains one of the world's most iconic cities, and the connection many residents have to it outlasts the disruption, or shift in decision-making, that any one cycle may bring.”


